10 F3 Debug Screen Shortcuts Every Minecraft Player Should Know
Filed under Minecraft Tips & Tricks · How we create content
Key Takeaways
| Point | Details |
|---|---|
| F3+A reloads all chunks | Instantly fix glitched terrain and invisible blocks without restarting your game. |
| F3+H shows item durability | Toggle advanced tooltips to see numeric durability, item IDs, and NBT tags in your inventory. |
| F3+G draws chunk borders | Visualize the 16x16 block grid to optimize farms, find slime chunks, and align redstone builds. |
| F3+S dumps dynamic textures | Force-reload all textures to fix the pink-and-black checkerboard glitch without restarting. |
| F3+Q shows all shortcuts | Press it to display a help menu of every F3 debug screen shortcut combination in the chat. |
Table of Contents
- What is the F3 Debug Screen in Minecraft?
- 10 Essential F3 Debug Screen Shortcuts
- How Do You Use F3 to Monitor Minecraft Performance?
- Why Does My F3 Screen Look Different on a Server?
- Tips for Mastering the F3 Menu
- How to Put This Into Practice on Gaia Legends
- Conclusion
- Frequently Asked Questions
- Recommended
You've probably mashed F3 by accident and panicked when a wall of text filled your screen. But the minecraft f3 debug screen shortcuts are some of the most powerful tools in the game. They let you see exactly what's happening under the hood—your exact coordinates, current frame rate, what direction you're facing, and even which chunk you're standing in. Whether you're lost in a cave, trying to diagnose sudden lag, or just want to know why your farm isn't working, the F3 menu has answers. Here are the 10 shortcuts you'll actually use.
What is the F3 Debug Screen in Minecraft?
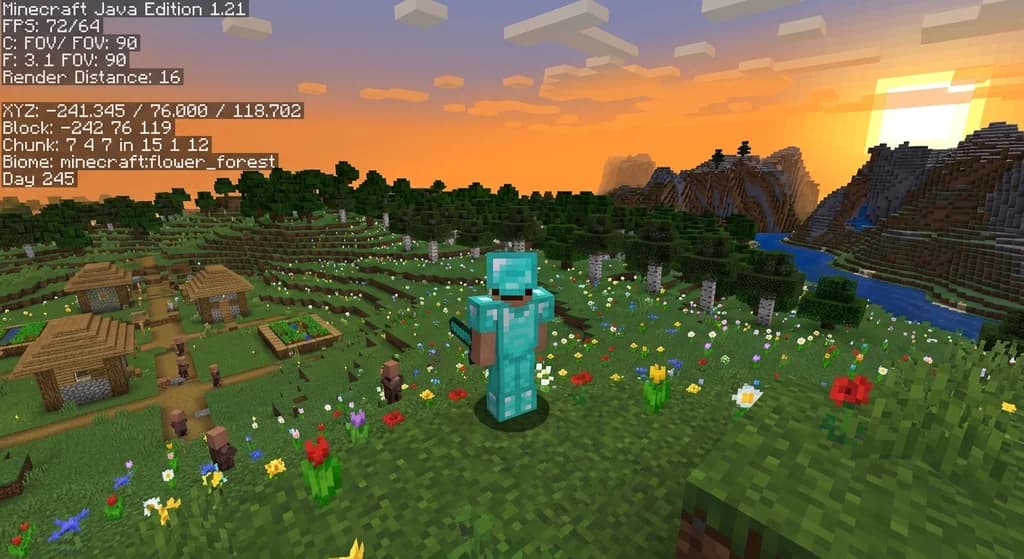
The F3 debug screen is a built-in diagnostic overlay that displays real-time technical information about your Minecraft world, including coordinates, performance metrics, and block data.
Pressing F3 (or Fn+F3 on some laptops) opens a heads-up display packed with data. The top-left shows your Minecraft version and frame rate. Below that, you'll find your exact XYZ coordinates, the block you're looking at, the biome you're in, and whether you're in a slime chunk. The right side displays your system's memory usage, Java version, and CPU load. It's the same information developers use to debug the game—hence the name. For a deeper dive into how coordinates work with other game mechanics, check out our guide on how to use wind charges in Minecraft 1.21.
10 Essential F3 Debug Screen Shortcuts
These ten keyboard combinations unlock the debug screen's most useful features, from reloading chunks to measuring frame times.
Here are the shortcuts, ranked from most useful to most niche:
| Shortcut | What It Does | When to Use It |
|---|---|---|
| F3 | Toggles the full debug overlay | Checking coordinates, FPS, or biome |
| F3+A | Reloads all loaded chunks | Fixing invisible blocks or visual glitches |
| F3+H | Toggles advanced tooltips | Seeing item durability numbers and IDs |
| F3+G | Shows chunk borders | Finding slime chunks or aligning builds |
| F3+B | Shows entity hitboxes | Debugging mob farms or aiming projectiles |
| F3+T | Reloads all resource packs and textures | Fixing broken textures without restarting |
| F3+S | Dumps dynamic textures to disk | Forcing a texture refresh in-game |
| F3+D | Clears the chat history | Decluttering your screen quickly |
| F3+Q | Displays a help menu of all F3 shortcuts | Learning what each combination does |
| F3+Esc | Toggles pause-without-pause-menu | Taking screenshots of the debug screen |
Pro Tip: If F3 alone doesn't work, try Fn+F3. Many laptops default the F-keys to media controls, so you need to hold the Fn key to send a true F3 signal.
F3+A: The Instant Chunk Reload
This is the shortcut you'll use most after coordinates. If you ever see missing chunks, invisible blocks, or terrain that looks glitched, press F3+A. It forces Minecraft to reload every chunk currently loaded around you. This is especially useful on multiplayer servers where chunk loading can sometimes desync. If you're building complex redstone contraptions that rely on chunk alignment, understanding chunk borders is essential—and it pairs perfectly with learning how to use the Minecraft crafter for automatic crafting in 1.21.
F3+H: See What Your Items Really Are
Toggle this once and never turn it off. F3+H enables advanced tooltips, which show you the numeric durability of every tool and weapon (e.g., "Durability: 250/1561"), the exact item ID (like minecraft:diamond_pickaxe), and even NBT tag data for custom items. This is invaluable for comparing gear or diagnosing why two seemingly identical swords deal different damage. The advanced tooltips also reveal the color codes of dyed leather armor and the contents of shulker boxes without opening them.
F3+G: The Chunk Border Overlay
F3+G draws bright blue lines along every chunk boundary in a 16x16 grid. A chunk is the fundamental unit of world generation in Minecraft, and many game mechanics—from mob spawning to crop growth—depend on chunk boundaries. This overlay is critical for automating crop farming with villagers, as villager crop detection and harvesting follow chunk-aligned rules. It's also the only way to visually confirm you're building a slime farm in an actual slime chunk.
How Do You Use F3 to Monitor Minecraft Performance?
The F3 screen's performance graph and memory readouts let you diagnose lag spikes, identify memory leaks, and see exactly what's slowing your game down.
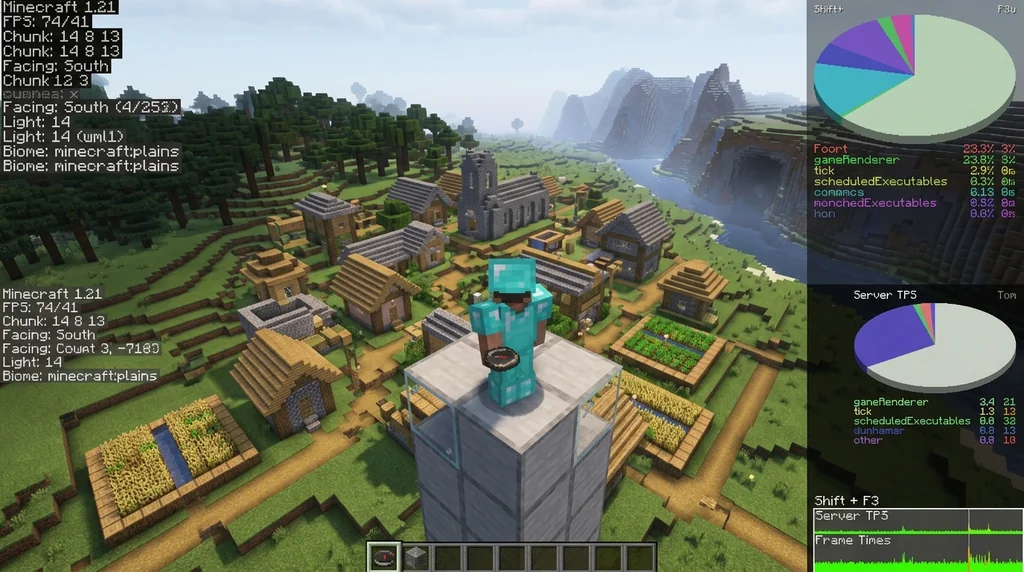
Look at the top-left corner of the debug screen. You'll see your current FPS (frames per second), followed by a real-time graph. A steady, high number (60+ FPS) means your game is running smoothly. Dips and spikes in the graph indicate lag events. Below the FPS, you'll find memory usage: "Mem:" shows what percentage of allocated RAM Minecraft is using. If this number climbs to 100% and stays there, the game will freeze while Java performs garbage collection. The debug screen also displays your render distance, simulation distance, and the number of loaded chunks—all of which directly impact performance. This data is crucial for diagnosing why your game stutters when you explore new terrain or enter a busy area on a server. For players who love exploring, knowing how to track your position while monitoring performance is key, much like when you're learning how to tame every rideable mob and choose the best mount.
Warning: The F3 screen itself uses system resources to render. If you're already struggling with low FPS, keeping the debug screen open will make it slightly worse. Use it to diagnose, then close it when you're done.
The Pie Chart: Shift+F3
Hold Shift and press F3 to open a performance profiler pie chart. This chart breaks down exactly what your CPU is spending time on—tick rates, rendering, entity updates, and more. If one slice of the pie is disproportionately large, you've found your bottleneck. This is an advanced tool, but it's the most precise way to figure out why your game is lagging.
Why Does My F3 Screen Look Different on a Server?
Multiplayer servers reduce the amount of information displayed on the F3 screen for security and performance reasons.
When you join a server like Gaia Legends, you'll notice the debug screen is slightly different. The most obvious change is that the "E" (entities) line shows only the entities in your immediate render distance, not the entire server. The "C" (chunks) section will also reflect only what your client has loaded, not the server's total. Some servers also disable specific debug features, like the ability to see block entities through walls, to prevent players from using the F3 screen as an x-ray tool. The core features you need—coordinates, FPS, biome, and chunk borders—still work exactly the same way. If you're hunting for rare mobs, the entity counter in F3 is a powerful tool, and it pairs well with our guide on how to find every Minecraft wolf variant and best spawn locations.
Note: On some servers, the
reducedDebugInfogamerule is set totrue. This hides coordinates and other location data from the F3 screen. If you can't see your XYZ on a server, ask an admin if this rule is enabled.
Tips for Mastering the F3 Menu
The F3 menu is intimidating at first, but focusing on a few key lines and memorizing the most useful shortcuts turns it from a wall of noise into a powerful toolkit.
Here are the most important lines to read on the full debug screen, in order of usefulness:
- XYZ Coordinates: Your exact position. X and Z are horizontal; Y is elevation.
- FPS and Performance Graph: Your current and historical frame rate.
- Block: The block your crosshair is pointing at, including its state (e.g., "waterlogged").
- Biome: The biome you're standing in. Essential for finding specific mobs or structures.
- Local Difficulty: A hidden value that increases the longer you spend in one area, affecting mob spawns.
Don't try to memorize the entire screen. Start with these five lines and the F3+A, F3+H, and F3+G shortcuts. The rest you can learn as needed. For a practical example of how biome and location data can lead to rare discoveries, you can apply these same observation skills when learning how to locate ancient cities fast without cheats.
How to Put This Into Practice on Gaia Legends
Now that you know how to read the debug screen, you can put it to work on Gaia Legends. Use F3+G to plan your base so it sits perfectly within chunk boundaries—this prevents the half-crop glitch where plants at a chunk edge grow slower than the rest. Toggle F3+H to compare the exact durability of your tools with your friends and know precisely when it's time to craft a replacement. And if you ever experience lag while exploring our custom terrain, pull up the Shift+F3 pie chart to see if the bottleneck is on your client or the server.
Gaia Legends is free to join, non-pay-to-win, and supports Java + Bedrock crossplay. Whether you're a technical player who wants to optimize every tick or a builder who just wants to align their cathedral to the chunk grid, these F3 tools will make your experience smoother.
Join at gaialegends.pro and start your legend today.
Conclusion
The F3 debug screen isn't just for developers—it's the most powerful utility every Minecraft player has installed by default. Here's what to remember:
- F3+A is your instant fix for visual glitches and missing chunks.
- F3+H unlocks detailed item information you'll wonder how you ever lived without.
- F3+G reveals the hidden chunk grid that governs everything from mob spawning to crop growth.
Learn these three shortcuts first, and the debug screen will stop being a scary wall of text and start being your favorite in-game tool.
Ready to play? Join Gaia Legends today — no pay-to-win, Java + Bedrock crossplay.
- Java:
join.gaialegends.pro - Bedrock:
join.gaialegends.pro— Port19132
Further reading
These references were recorded with the article; specific claims have not been matched to source excerpts.
Frequently Asked Questions
What are the most useful Minecraft F3 debug screen shortcuts?
The most useful shortcuts are F3+A (reload chunks), F3+H (toggle advanced tooltips for item durability and IDs), F3+G (show chunk borders), and F3 itself (toggle the full debug overlay with coordinates and FPS). These four cover 90% of what you'll ever need from the debug screen.
How do I use F3 on a laptop that has media keys?
On most laptops, the F-keys default to media controls like volume and brightness. To use F3, hold the Fn key (usually near the bottom-left of the keyboard) and press F3. You can also change this behavior in your BIOS or system settings so F-keys work as standard function keys.
Why can't I see my coordinates on the F3 screen?
If you're on a multiplayer server, the admin may have enabled the `reducedDebugInfo` gamerule, which hides coordinates and other location data on the F3 screen. In singleplayer, coordinates are always visible. If you're on a server and coordinates are hidden, ask an admin about the gamerule.
Does opening the F3 screen lower my FPS?
Yes, the F3 debug screen itself uses system resources to render all that text and the performance graph. On low-end computers, this can cause a noticeable drop in FPS. Use the debug screen to diagnose problems, then close it when you're done playing normally.
What does the pie chart in Shift+F3 show?
The Shift+F3 pie chart is a real-time profiler that breaks down what your CPU is spending time on. Each slice represents a task like rendering, entity updates, or chunk loading. A disproportionately large slice indicates a performance bottleneck you can target with optimization mods or settings changes.
Can I use the F3 debug screen to find slime chunks?
Indirectly, yes. Press F3+G to show chunk borders, then note the chunk coordinates displayed on the debug screen. Slime chunks are determined by a formula based on the world seed and chunk coordinates. You can then cross-reference those coordinates with an online slime chunk finder tool to confirm.
Related guides
Minecraft Food Mechanics: Eating, Hunger, and Saturation
Learn how eating, hunger, and saturation work in Minecraft. This quick reference covers consumption time, health regeneration, sprinting limits, and starvation damage.
How to Use Beacons in Minecraft: Complete Beacon Guide 2026
Learn how to use a beacon in Minecraft with our 2026 guide. Covers crafting, building, effects, activation, pyramids, and tips. Includes interactive range...
How to Use the Minecraft Recovery Compass in 2026: Full Guide
Learn how to use the Minecraft recovery compass to find your death location, craft it with echo shards, and never lose your items again. Full 2026 guide...
How to Automate Item Sorting with Allays in Minecraft 2026
Learn how to automate item sorting with allays in Minecraft 2026. Our minecraft allay automation guide covers taming, duplication, and note-block sorting...
Have a question or another approach?
Compare notes with other readers. Include your edition and version when discussing mechanics.